What gets measured gets done. What doesn't get measured doesn't get done. Both of these statements are true. Your veterinary team is the heart of your revenue-generating team. They are the center of providing veterinary service. They are the revenue generators that determine the outcome of your practice.
In any business, it is important to set goals, and then to measure accordingly along the way to measure progress towards those goals. In veterinary medicine, setting production goals is necessary to ensure that all doctors on the team are focused on productivity that will result in satisfied clients and a healthy practice. Revenue is the result of much of the veterinary activity, and it is the basis on which veterinarians are paid, either directly or indirectly. Without revenue, the practice cannot pay its people or provide quality service to its patients. Revenue is one measure of success, but not the only measure.
In order to assess progress towards goals set regarding revenue production, the Trailing 12 (T-12) Chart is a great way to monitor revenues by doctor. The T-12 chart plots revenue by month for each doctor, with each data point in the chart including the most recent 12 months of data. This trailing 12 or rolling 12-month average representation effectively removes all seasonality, since each data point includes all 12 months of data. Thus the only difference from one data point to another is the newest month has been substituted for the oldest month in the previous data point. The result is that the true trend or difference between periods is revealed. Note the two charts below which represent examples of T12 Revenue by doctor. It is relativley easy to track progress of each doctor and to assess progress towards the goals established, if known, and the trend of increasing versus decreasing production is evident. Use T12 charts to track the true trends to help your team.
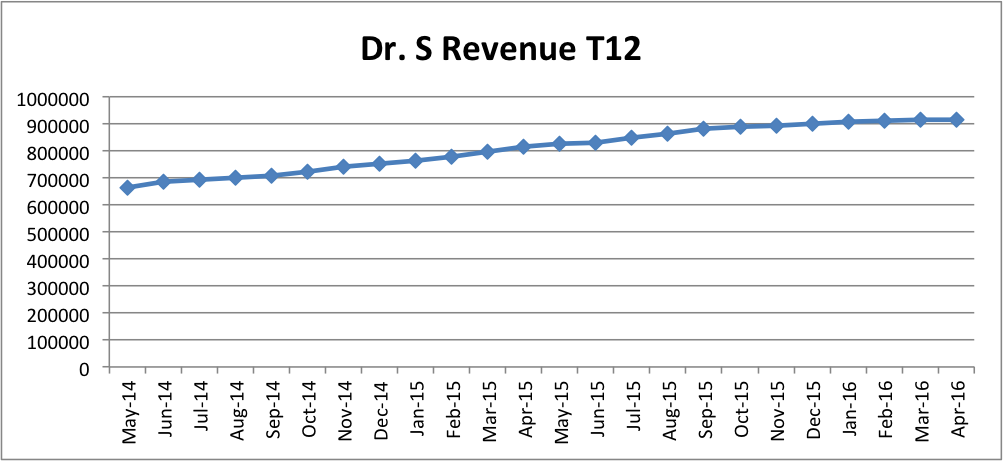
Above: T12 Revenue for Dr. S. Note the trend of increasing revenue.
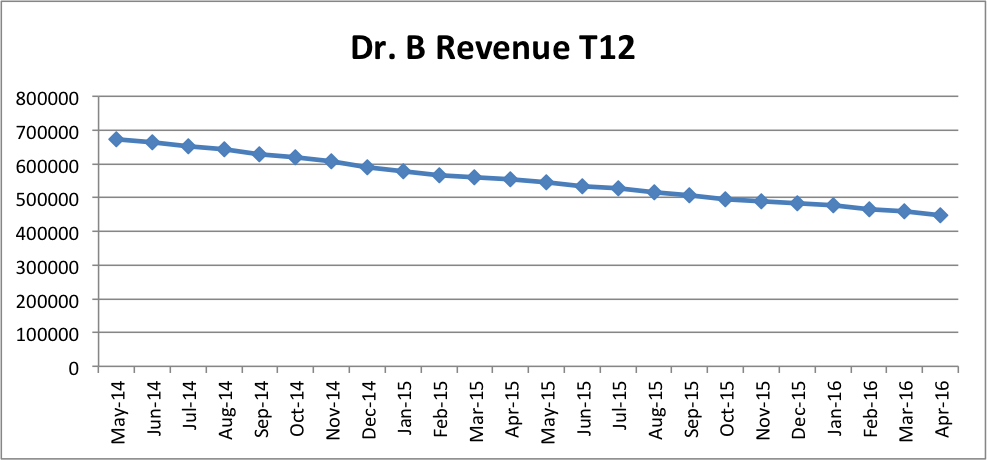
Above: T12 Revenue for Dr. B. Note the trend of decreasing revenue.
